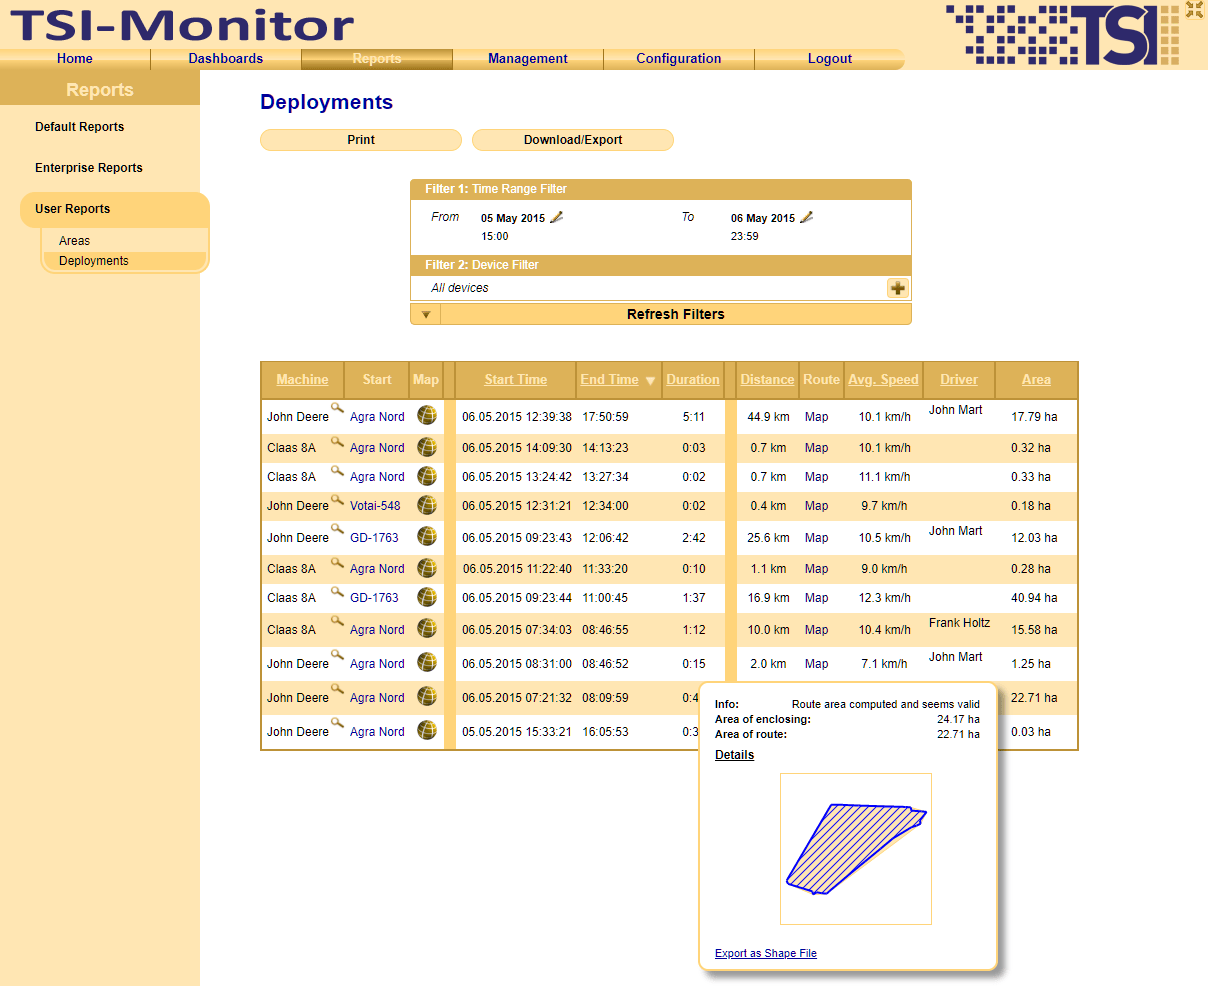
Calculation of processed area
A common sticking point is the billing of processed areas,
because often the field boundaries are not available digitally or there
is only inaccurate information, for example, for sections of fields.
But for an exact and fair billing, these data are of essential importance.
TSI Fleetmanager
solves these problems fast, easy and conveniently
with an automatic calculation of processed areas.
Of course, the areas are not only clearly visualized, but are also
directly available for export, e.g. as a shapefile in ETRS89 or UTM format.
.jpg)
Maintenance Planning
The need of expensive agricultural machinery for regular and preventative maintenance is
well known.
Down-time of one of these machines, can quickly and easily tear a giant hole into
the cash flow.
Every single hour of down-time costs money and the cost of repairs for the machines
can quickly amount to considerable sums.
Prevent down-times with TSI!
Well-maintained vehicles and machines last longer, work more reliably and do not require premature replacements.
TSI's integrated maintenance log not only covers the history of all
maintenance and inspections and the associated specific vehicle costs,
but also makes the planning for future, upcoming maintenance a breeze.
.png)
Theft Protection with TSI
Monitoring & Alerting
.jpg)
„Stop Diesel Theft!“
Prevent the theft of diesel or fuels on your vehicles and machines or use
TSI Fleetmanager
for theft protection and
be immediately notified, for example, by text message if one of your vehicle leaves a permitted area.
Use TSI's monitoring platform to trigger immediate alerts for
unusual activities on your machinery,
thus, optimally protecting your investments.
Documentation, Assessment & Analysis
With integrated, zoomable maps you always
have all your vehicles at a glance and can
track progress live. The system monitors automatically the location,
and records all deployments, vehicle data and operating hours of your agricultural machinery,
harvesting machines, tractors and agricultural equipment.
With TSI you not only monitor, document, and assess your machinery but you are
in full control of your operations.
Among many other options, the visualisations for example allow to show driven speeds
in a colour coding or to examine the exact areas in which attachments were used.
With flexible reporting it is easy to gain a deep understanding of your operation by presenting data
by hours, days or months, divided into sub-areas, grouped by type of operation, differentiating
ways to the field, idling, work periods,
or assignment to different enterprises.
That, and much more...


 Deutsch